


Oil and natural gas: Oil finds new support on Friday
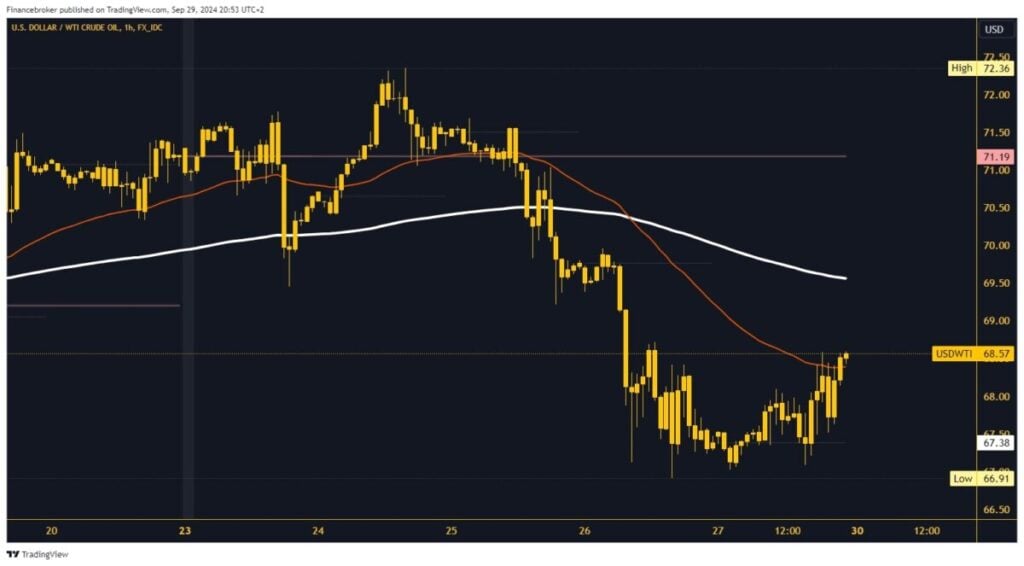
- The price of oil managed to stop the decline on Friday and stabilize above the $67.00 support level
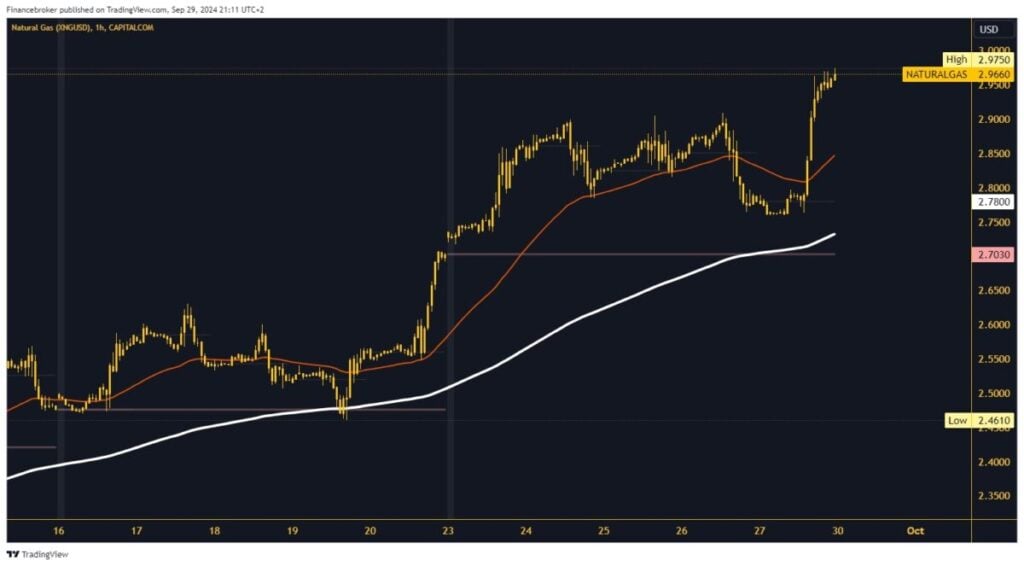
- On Friday, after consolidating the price of natural gas in the $2.75-$2.80 range, we saw a break above and a jump to a new weekly high of $2.97
Oil chart analysis
The price of oil managed to stop the decline on Friday and stabilize above the $67.00 support level. After that, the price started a bullish consolidation above $68.50, where we expect the support of the EMA 50 moving average. We have solid bullish momentum and expect oil to take advantage of that to move higher this week. In the $69.50 zone, we encounter the EMA 200 moving average, and there we can expect the next stronger resistance.
If we manage to move above, oil prices could soon exceed the $70.00 level. Potential higher targets are $70.50 and $71.00 levels. The drop of oil below the EMA 50 moving average and the $68.00 level would reduce the optimism that we have the strength to stay on the bullish side. A further pullback to $67.50 would reinforce the bearish momentum. The next step is to test the previous low and continue the pullback to the bearish side. Potential lower targets are $67.00 and $66.50 levels.
Natural gas chart analysis
On Friday, after consolidating the price of natural gas in the $2.75-$2.80 range, we saw a break above and a jump to a new weekly high of $2.97. The reason for this jump is most likely the hurricane that hit Florida and forced the shutdown of wells until the storm passes. This week, we expect the price to stabilize and stay below the $3.00 level. A bullish trend has followed us since the beginning of September.
Should natural gas continue its momentum, it could soon move above $3.00 to a new three-month high. Potential higher targets are $3.05 and $3.10 levels. We also do not rule out a possible pullback below the $2.90 level. With that step, the price moves to the last week’s movement range. We expect a pullback in line with the September trend. Potential lower targets are $2.85 and $2.80 levels. The EMA 200 moving average, our bearer of the bullish trend, is in the $2.75 zone.
The post Oil and natural gas: Oil finds new support on Friday appeared first on FinanceBrokerage.